Most ECMO teams already have a rhythm with their anticoagulation protocol: PTT or anti-Xa every six hours, adjust the drip, recheck, repeat.That’s the backbone of anticoagulation management for a lot of programs, and for some, it’s the whole picture. However, some programs add TEG into that mix too, and it works differently from the more traditional coag labs.
TEG, short for thromboelastography, is a whole blood clotting test first used clinically in liver transplant surgery in the late 1960s. From there it spread into cardiac surgery and perfusion, and its application in ECMO has grown alongside that, though it’s still far from universal. How often it’s actually used is hard to pin down, and seems to depend heavily on the program. Clinicians at smaller or more cost-conscious programs may have never worked with it, while those at large academic centers may already know its ins and outs well.
TEG isn’t meant to replace PTT or anti-Xa. It’s meant as a complement, run less often but adding a different kind of information. Think of it like the difference between standard bedside telemetry and a 12-lead EKG. Whichever one a program uses, PTT or anti-Xa, that’s the telemetry every ECMO patient is already on: continuous and familiar, good at catching a change in real time. TEG is closer to the 12-lead: you don’t pull it as often, but when you do, you get a much fuller picture of what’s actually going on.
This blog walks through what that fuller picture actually shows, how it works, what it can catch that PTT and anti-Xa can’t, and how clinicians can use the pattern to make sense of what’s happening.
A Different Way of Measuring Clotting
PTT and anti-Xa are run on plasma, the liquid portion of blood after the blood cells are spun out, while TEG runs on whole blood, platelets included. This is because most thrombin (the enzyme that drives clot formation) gets generated on the surface of activated platelets. Pulling platelets out to study clotting leaves out most of where clotting actually happens. Because TEG uses whole blood, it captures the combined effects of platelets, fibrinogen, clotting factors, and clot breakdown rather than isolating one part of the system.
This broader view of coagulation is what makes TEG especially useful in ECMO patients. It’s not uncommon for ECMO patients to have more than one coagulation problem at a time. TEG can show how anticoagulation, platelets, fibrinogen, clotting factors, and fibrinolysis are functioning together, which can help explain a bleeding or clotting picture that a PTT or anti-Xa alone cannot.
The Five Numbers
TEG runs on a small, cartridge-based analyzer, not much bigger than a countertop coffee maker, and where it actually lives varies by hospital. Some keep it centralized in the core lab, some place it in the OR or perfusion room, some run it fully point of care on the unit. Who draws and runs it varies just as much, sometimes perfusion, sometimes the bedside nurse or ECMO specialist, sometimes the sample gets sent down to a lab elsewhere entirely.
A full trace can take around 30 minutes to complete, but because the result builds in real time on screen, teams don’t always have to wait for the final number and decisions can be made while the shape is still forming.
TEG gives you a handful of key measurements that describe different parts of clot formation and breakdown. On the TEG 6s, the main values include the following, though the exact set can vary by system and cartridge:
- Two reaction times (CK-R and CKH-R), one with heparin active and one with it neutralized. Comparing them shows how much heparin is contributing to delayed clot formation.
- Overall clot strength (CRTH-MA), or how strong the clot becomes once it reaches its maximum.
- Fibrin-based clot strength (CFFH-MA), measured with the platelet contribution suppressed. Comparing this with overall clot strength helps determine whether a weak clot is more likely related to fibrinogen or platelets.
- Lysis at 30 minutes (LY30), which shows whether the clot remains stable or begins breaking down too quickly.
You do get each of these values as a number, but TEG also displays them as part of a tracing or shape that shows clot formation over time. The tracing starts as clotting begins, widens as the clot gets stronger, reaches its maximum width at peak clot strength, and can narrow again if the clot starts to break down.
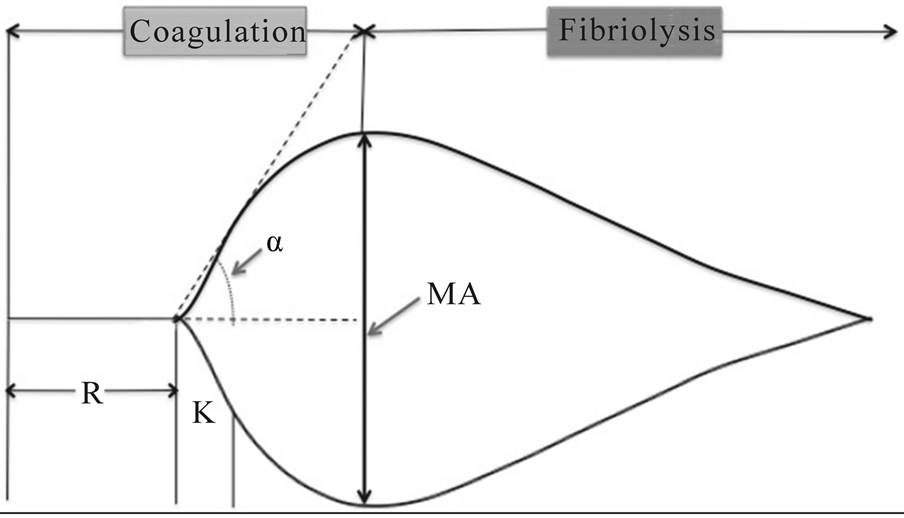
Normal TEG tracing, depicting rate of formation and degradation of clot, as well as the MA, R, α and K. Source: Open Journal of Anesthesiology
A single TEG result already tells you a lot in the moment, but a lot of valuable insight comes from monitoring trends. A gradual shift over a few days can flag a problem building before it shows up anywhere else, such as the anticoagulant becoming less effective or the patient’s own clotting factors starting to fail on their own.
Interpreting the Pattern
The value of TEG is not that one abnormal number automatically maps to one treatment. It is that the pattern can help narrow down what is changing and why, giving the team a better idea of what to do about it.
Some programs build that interpretation directly into their TEG software, with alerts or guidance tied to their own thresholds. Others keep it much simpler and leave most of the interpretation to the clinical team. Either way, the same values can provide clues that are difficult to get from PTT or anti-Xa alone. For example:
- The ratio between CK-R and CKH-R can indicate whether heparin is having the intended anticoagulant effect: If CK is too close to CKH, heparin may not be having enough effect; if it is much more prolonged, the effect may be excessive. Some ECMO protocols target a CK roughly 1.5-3 times as long as CKH, although the exact target varies by program.
- A changing CK-to-CKH relationship can flag possible heparin resistance: If the two values move closer together over time despite the same or a higher heparin dose, the patient may be becoming less responsive to heparin. Because heparin relies on antithrombin to work, that pattern may prompt the team to check an antithrombin level.
- A rising LY30 can sometimes point toward clot formation elsewhere in the system: Increased clot formation can trigger secondary fibrinolysis, which appears on TEG as increased clot breakdown. In an ECMO patient, that may be a reason to look more closely at both the patient and the circuit for thrombosis.
A Few Common Questions
What’s the difference between TEG and ROTEM?
They’re two different viscoelastic testing systems built around the same basic idea: using whole blood to track clot formation, strength, and breakdown over time. The main differences are the analyzers, reagents, assay names, and terminology they use, so the results are conceptually similar but not directly interchangeable.
Does TEG work for patients on argatroban or bivalirudin instead of heparin?
The TEG cartridge used in ECMO is only FDA-labeled for heparin. Published literature suggests TEG is sensitive to other anticoagulants like argatroban, bivalirudin, and DOACs, but using it that way falls outside the approved labeling.
How often should TEG be checked in an ECMO patient?
There is no standardized frequency. Published ECMO protocols range from roughly every 4–8 hours to a few times per day, while other programs use TEG more selectively when the coagulation picture changes, so frequency ultimately depends on the program’s protocol and the patient’s clinical situation.
Does transfusion change the TEG result?
Yes, and that’s partly why repeat testing can be useful. Platelets, fibrinogen replacement, plasma, and other interventions can alter different parts of the tracing, allowing teams to see whether the coagulation picture changed in the expected direction.
Is TEG expensive?
A cartridge costs about $100, which can feel significant, especially for smaller or more cost-conscious programs. But in the context of an ECMO admission that may cost hundreds of thousands or even millions of dollars, it’s a relatively small expense, particularly if the additional information helps avoid unnecessary blood products or better target treatment.